


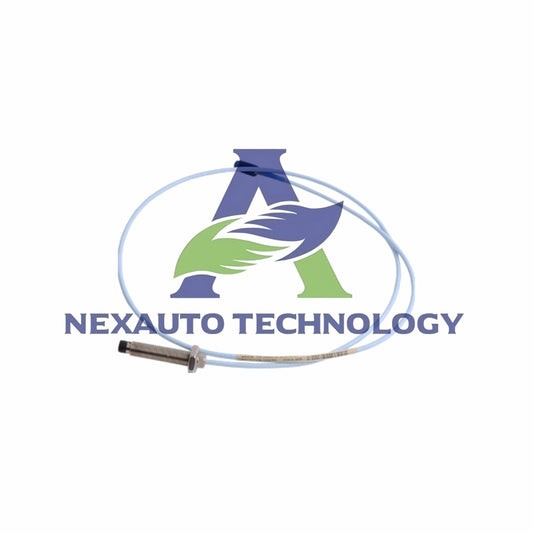



Bently Nevada Vibration Monitoring Integration: Smarter Industrial Automation for 2026
Rotating equipment underpins nearly 70% of uptime in heavy industry. Therefore, reliable vibration data has become essential for industrial automation and predictive maintenance strategies. Bently Nevada systems offer high-resolution monitoring for turbines, compressors, and pumps. In fact, plants integrating these solutions report up to 30% fewer unplanned outages. Moreover, maintenance expenses often fall by 15% to 25% within the first year. As a result, integration is now a strategic investment, not just a technical upgrade.
Why Vibration Integration Matters in Modern Factory Automation
Condition-based maintenance depends on accurate machine health data. Bently Nevada sensors and monitors feed real-time insights into control systems. Consequently, engineers detect faults earlier and schedule repairs proactively. This approach reduces downtime and extends asset life. For B2B industrial operators, this translates directly to lower total cost of ownership.
Core Architecture: Sensors, Monitors, and Protection Modules
A typical setup includes proximitors, accelerometers, and velocity sensors. These devices connect to 3500 series monitors or 3300 XL protection modules. The 3500/42M monitor, for example, handles seismic and proximity inputs simultaneously. Each channel samples data at rates up to 25.6 kHz. Meanwhile, the 3500/22M transient data interface stores up to 1 GB of event data. Therefore, engineers capture startup and coast-down events with high fidelity.

Vibration Data Collection Methods and Sampling Standards
Data collection follows API 670 and ISO 10816 standards for consistency. Systems typically record overall vibration from 0.1 Hz to 10 kHz. In addition, spectral analysis resolves frequencies up to 40 kHz for gear mesh faults. Route-based collection uses portable collectors with 51.2 kHz sampling. Online systems, however, stream continuous data at 10 to 100 samples per second. As a result, hybrid strategies balance cost and diagnostic depth effectively.
Key Vibration Parameters and Alarm Thresholds
Velocity RMS values usually range from 0.5 mm/s to 11 mm/s across machine classes. For instance, ISO 10816-3 sets 2.8 mm/s as a warning limit for medium machines. Displacement readings for sleeve bearings typically stay below 75 micrometers peak-to-peak. Furthermore, acceleration levels above 10 g indicate early bearing degradation. Alarm setpoints often use two tiers: alert at 60% and danger at 100%. Consequently, operators respond before damage becomes catastrophic.
Data Analysis Techniques for Fault Diagnosis
Analysts apply FFT spectra, envelope analysis, and orbit plots for diagnosis. Envelope analysis, for example, detects bearing defects at frequencies up to 500 Hz. Orbit plots reveal misalignment and oil whirl in journal bearings. Moreover, waterfall plots track vibration trends across 24 to 72 hours. Machine learning models now classify faults with 92% to 96% accuracy. As a result, false alarms decrease by nearly 40% in advanced implementations.
Integration with DCS, SCADA, and Historians
Bently Nevada systems connect to DCS platforms via Modbus TCP or OPC UA. OPC UA gateways transfer up to 10,000 tags per second reliably. Additionally, historians such as PI System store vibration data for 5 to 10 years. This integration enables cross-correlation between process and vibration trends. Therefore, engineers link flow surges to rotor instability quickly. Meanwhile, SCADA dashboards display real-time alarms within 500 milliseconds.
Performance Data and Measurable Outcomes
Integrated monitoring reduces mean time to repair by 20% to 35%. Predictive programs also extend bearing life by 8 to 12 months on average. One refinery reported a 22% drop in vibration-related failures after 18 months. Another plant cut annual maintenance spending by $450,000. Furthermore, energy consumption fell by 3% due to optimized rotor balancing. These figures confirm that data-driven decisions deliver tangible returns.
Best Practices for System Deployment
Engineers should mount sensors within 50 mm of bearing housings. Cable routing must avoid power lines to prevent electromagnetic interference. Additionally, grounding follows IEEE 1100 standards for noise reduction. Calibration checks occur every 12 months using certified shakers. Documentation should include baseline spectra for at least 30 operating points. Consequently, teams detect deviations within 5% of baseline values.
Future Trends in Vibration Monitoring
Edge computing now processes vibration data within 10 milliseconds locally. Wireless sensors with 5-year battery life reduce installation costs by 40%. Meanwhile, digital twins simulate rotor behavior with 95% predictive accuracy. Cloud platforms aggregate data from 1,000+ machines across multiple sites. Therefore, remote experts diagnose faults without visiting the plant. Eventually, autonomous systems will trigger maintenance orders automatically.
Conclusion: Turning Vibration Data into Action
Bently Nevada integration transforms raw vibration signals into actionable insight. With sampling rates up to 25.6 kHz and 96% fault classification accuracy, results speak clearly. Plants adopting these systems gain 20% to 35% faster repairs and lower costs. Therefore, integration deserves priority in every reliability roadmap. Finally, continuous analysis ensures machines run safely, efficiently, and longer.

Key Takeaways
First, integrate sensors with 3500 series monitors for reliable protection. Second, follow ISO 10816 thresholds to set alert and danger alarms. Third, use OPC UA for seamless DCS and historian connectivity. Fourth, apply envelope and FFT analysis for early fault detection. Fifth, review baselines every 12 months to maintain accuracy.
Application Case: Refinery Compressor Monitoring
A Middle Eastern refinery integrated Bently Nevada 3500 monitors on three critical compressors. The team used OPC UA to stream data into a PI System historian. Within six months, they detected a bearing defect two weeks before failure. As a result, planned maintenance avoided a $200,000 emergency shutdown. This case shows how industrial automation and vibration analysis work together.
Solution Scenario: Hybrid Monitoring for Pump Fleets
Many plants combine online monitors with portable route-based collectors. Online systems watch critical pumps continuously. Portable collectors, however, cover less critical assets monthly. This hybrid model reduces hardware costs by 30% while maintaining coverage. Moreover, it gives reliability teams flexibility to scale monitoring as needs change.
Frequently Asked Questions
What is Bently Nevada used for in industrial automation?
Bently Nevada systems monitor vibration and position on rotating machinery. They provide early fault detection for turbines, compressors, and pumps. This supports condition-based maintenance and reduces unplanned downtime.
How often should vibration sensors be calibrated?
Most industrial sites calibrate vibration sensors every 12 months. Certified shakers verify accuracy against known references. However, harsh environments may require more frequent checks.
What standards apply to vibration alarm thresholds?
ISO 10816 and API 670 are the primary standards. ISO 10816-3, for example, sets 2.8 mm/s as a warning limit for medium machines. API 670 covers protection system requirements.
Can Bently Nevada systems integrate with existing DCS and SCADA?
Yes. They connect via Modbus TCP or OPC UA. OPC UA gateways transfer up to 10,000 tags per second. This enables seamless data flow into DCS, SCADA, and historians.
What sampling rate is needed for gear mesh fault detection?
Spectral analysis typically resolves frequencies up to 40 kHz. Therefore, a sampling rate of at least 80 kHz is advisable. However, 25.6 kHz often suffices for general waveform capture.
© 2026 NexAuto Technology Limited. All rights reserved.
Original Source: https://www.nex-auto.com/
Contact: sales@nex-auto.com
Phone: +86 153 9242 9628
Partner AutoNex Controls Limited:
https://www.autonexcontrol.com/
Check below popular items for more information in Nex-Auto Technology.
